In this post, we'll look at the chance someone is tenpai based on the number of tedashis they've done, as well as what that tedashi is.
Before we get into the analysis, I want to mention something. This analysis involves calculating shanten a lot. A LOT. The analysis has to calculate the shanten of a hand over six hundred million times to gather this data. This would be highly impractical with the usual recursive shanten algorithm.
I ported over an algorithm written by spinesheath. You can find it in C# here, and my python conversion here. This algorithm is much much faster. It reduced the time down to one percent of what it would have been with the old algorithm.
Take a look. This is what running the analysis looks like with the old algorithm.
It would have taken two weeks of me leaving my computer on 24/7 to finish it. But, this is what running the analysis looks like with the new algorithm.

Much better. You can expect many more shanten-heavy analyses in the future.
Anyway, let's start with the base tenpai chances and work from there.

The closed hands are dama hands. If a player declares riichi, the round will no longer be looked at, to trim out folding. As we can see, the chance of dama is not too great during the first nine turns.
Let's see how this chance changes when the player tedashis a tile. A tedashi is when the player discards a tile from their hand, instead of the one they drew, indicating a hand change.

Middle tiles are the most dangerous in this regard, as one might expect considering they're the most useful tiles in general. You want to hold them for a long time.
However, it's interesting that the tenpai rates go down relative to the average as we get further into the round. Though, it makes sense. A player who is tenpai would be repeatedly tsumogiri-ing, waiting for their win. Then, the tedashis could be them folding to a threat that emerged.
Let's look at the tenpai chance by the number of tiles they've tedashi'd.
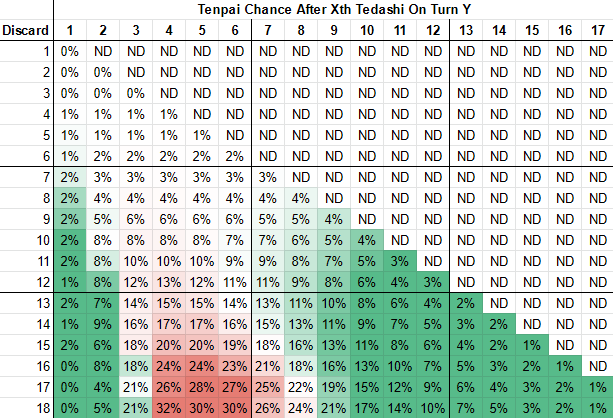
Somewhere around 4 to 7 tedashis is the danger zone. Considering a hand usually starts out at 3 or 4 shanten, they would need to change it at least three or four times to become tenpai. Any less than this, and they probably haven't drawn the tiles they need. But, if they're constantly cutting tiles from their hand, either they're going for something far off, or they're folding.
Since the type chart showed a trend of tenpai chance going down later, it seems the 4~7 area isn't contributing much. Let's look at the distribution.

Comparing to the previous chart, we can see that the 4~7 area in row 3 is very rarely reached, with 8~12 being more common. Having a low number of tedashi is very rare. A square gets colored gray if it's below 0.5%.
There's one other chart, which is the average shanten by number of tedashi.

So, after seeing all this, I feel a logical question to ask is: What about tsumogiris?
Well, let's flip a boolean in the analysis, run it again, and find out! In the meantime, you can find the tedashi data in this spreadsheet.

Tsumogiri is much more dangerous. Considering the tedashis were safer than average, it makes sense that the tsumogiris are more dangerous than average. Middle tile discards in the first row are dangerous regardless of tsumogiri or tedashi, but at that point they're still usually closer to 2-shanten than 1-shanten.

The streak of green on the right edge is probably from disconnected players. We can confirm that by looking at the frequency.

As expected, having a tsumogiri count close to the turn count is very rare. The average number of tsumogiris is around half the turn count. Finally, here's the average shanten.

You can find the data for tsumogiris in this spreadsheet. The code for the analysis can be found on GitHub.
Hey, just wanted to say this blog is really cool! I'm sitll just a begineer, but it's really nice seeing these statistics in detail.
ReplyDeleteRespect and I have a keen offer: How Much Is A Complete House Renovation house reno on a budget
ReplyDelete