If an image is hard to read, click on it for the full version. If you didn't see the schedule change in the previous post, the plan is to have personal updates on the first Thursday of each month, and do Houou replay analysis on the other Thursdays.
As this is a statistical analysis, we first need to keep in mind the sample size we're working with. All of these stats come from the four-player east-south games played in Houou between January 1st, 2011 through July 28th, 2019. This totals 1,246,147 replays, which contain a total of 13,368,314 rounds.
First, I want to look at how each round in Houou ends. A post, translated here, mentions that "in a usual high level game record, 40% of the games end in a draw." That seems ridiculously high, and people know that. So, what's the actual rate?

Only 15.5% of Houou games end in an exhaustive draw. If we include abortive draws, it's 16.6%. Maybe times have changed, or maybe it was a made-up statistic. If I look only at the 2011 games, the numbers don't change much.
The percentages in the fourth column show how the row relates to similar rows. The ones next to Ron and Tsumo are the percent of wins that are ron or tsumo, respectively. Double Ron's shows how many rons are doubles, and the abortive draws show the percent of abortive draws that are that type.
Let's put the numbers so far together. We have 13,368,314 rounds over 1,246,147 games, which is an average of 10.7 rounds per game. If 83.4% of rounds end with a win, and 59.5% of wins are ron, then that comes out to 5.32 deal-ins per game. Divided amongst four players, that's 1.33 deal-ins each. If we divide 1.33 deal-ins by 10.7 rounds, we get a deal-in rate of 0.124. If we look at this Tenhou page, we see that Houou players have an average deal-in between .119 and .125, so the stats look good so far!
Of course, everyone has a bad day now and then. What's the worst day a player's had? A day where they just couldn't stop dealing in? Let's look at the maximum number of deal-ins from any player in each game.
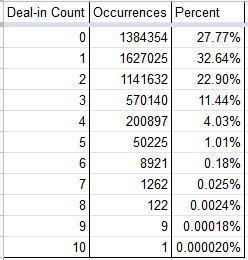
So, the vast majority of games only have any given player dealing in as much as twice, with the occasional thrice and the rare ... four times. One guy managed to deal in 10 times in the same game! If you'd like to watch that game and see if you could avoid the same fate, the replay is here.
If even a game like that can make it to South 4, any game can, right? Let's take a look at how often games reach, or end in, South 4.

Yup. Three-quarters of games end in South 4, and almost exactly 80% of them reach it or exceed it. This means 20% of games end before South 4. But, alas, poor Yuuki. Only one in fifteen games ends in the East round. I actually included honba in this search, and found that there was a South 4-13 game. Is this some insane comeback? See for yourself.
Now we know when the games usually end, but the round is only half the story. With dealer repeats, a game that ends in East 2 could have more rounds than a game that ends in South 4, so it's not really an accurate judgment of length. We already know from before that the average is 10.7 rounds, but what's the actual distribution?

It spikes between 10-11 rounds, so our earlier calculation seems correct. And, with 76% of games going to South-4, it comes as no surprise that the games with 8 or more rounds are much more common than the ones below eight. The longest game in this dataset was 27 rounds long. If you'd like to see one of those grueling matches, here is one of the replays.
The 8 column is interesting to me. How could we get the number of 0-honba games using that number? We could multiply it by the percent of South 4 games, then factor in the chance of having no exhaustive draws... or we could just check the replays. What's the most honba a game has at any point?

Most games will have at least one honba at some point, but rarely more than 3 or 4. Two games ended up going to the thirteenth honba. I linked one before, and you can find the other here.
While we're at it, we might as well look at how many riichi sticks end up in the pot. I'd be surprised if the number of 0 riichi games was higher than the number of 0 honba games.

As expected, games with no riichis are very rare. Most games have two, since that's easy to achieve with an oikake (chasing) riichi. It's also super rare to have more than 4 riichi sticks in the pot at once, but one game ended up with 10! How did they manage that? Maybe a four riichi abortive draw with other shenanigans? The replay is here, if you're curious.
We're getting a little off track with useless trivia, so let's take a step back to when we were looking at the average game length. We looked at the number of rounds in each game, so how about we go one step deeper. What's the average number of turns in each round?

A turn is defined as being simply 4 discards, by any players. We see a big spike at 17-18 turns. These are the turns where exhaustive draws happen, so it makes sense that a bunch of games end in that vicinity. They can't go any farther than that, after all. Plus, players will take some more risks to get tenpai in time for the end, and might deal-in during the final turn.
Looking before that, most Houou games end around the 10th turn, which is a bit after the middle of the second row. This is why people often say to take what you can get once you hit the second row. If you take too long, someone will win before you. In lower level games, where people have worse efficiency, you'll probably have a bit longer.
If we look at it by discards instead of turns, we see a small wavy motion. To me, this indicates that the dealer probably wins slightly more often than the other seats. It's easier for them to justify going for small hands. I'll be looking at playstyle changes by seat and placement in a future post, so look forward to that!
Phew, that was a lot of data. It's nothing that's really going to drastically change how we play, but it's a lot of interesting stats that I've seen people asking about here and there, and it was a good warm-up for me to get used to working with the replays.
You can find all the data in this spreadsheet. Use the tabs at the bottom to go through it all. There's some more granular stuff that I couldn't include in this post due to the massive vertical space it would take up, but it's not exactly more useful. Interesting to look at, though. Feel free to make a copy and mess with it all you'd like.
You can find the scripts that parsed all of this data in this zip. The replays themselves are not provided, as it's over 13 gigabytes. If you want to fetch them yourself, check out this repo.
Finally, I have a couple more interesting replays, for those of you who like that sort of thing. This is the replay that contains the highest ending score, and this is the replay that contains the lowest ending score.
Next week, we'll look at something more substantial. The current plan is to check how Houou players deal with the threat of Pao. If a player has two dragon pons, how willing are they to discard the third? Does it depend on their seat and placement? What happens when they do discard it? Find out next week!
Hi Amber, I have looked through your blog and really enjoy the content you have created. I am interested in doing some machine learning on a mahjong data set, and I was wondering if you had any advice for extracting Paifu from game replays. I saw you mention the script here https://github.com/MahjongRepository/phoenix-logs for downloading logs, but I do not understand Japanese, and was wondering if the text version of the Paifu can be found in the logs extracted by the above script. Thanks!
ReplyDelete